How the Hagerty Market Rating Works
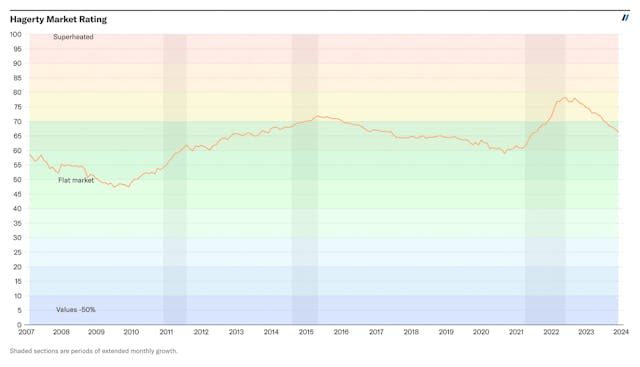
The Hagerty Market Rating measures the current status of the collector car market in terms of activity or “heat,” directional momentum, and the underlying strength of the market.
The Hagerty Market Rating is expressed as a closed 0-100 number with a corresponding open-ended index (like the DJIA or NASDAQ Composite).
The Hagerty Market Rating is unique because it is the only measure of the overall state of the classic vehicle market that employs a comprehensive algorithm of weighted market/transactional data (including the world’s largest database of private sale transactions), correlated financial market instruments and other market factors.
- Activity or “heat” is represented by variables like rate of change in auction activity (in numbers of transactions); private sales activity; the number of cars offered publicly for sale.
- Directional momentum is represented by multiple valuation trends plotted from auctions, private sales and insured values.
- Market strength (or weakness) is measured by variables such as Hagerty Price Guide values, public auction performance, subjective expert opinions, and other correlated financial market instruments.
- In this market, liquidity is represented by the intersection of number of cars on the market, private sale and auction sale activity.
While theoretically possible, ratings at or near the 0 or 100 poles are not likely to ever be seen. The higher the rating goes in the scale, the more market activity it takes to move the number. The same is true at the lower end of the scale.
Hagerty Market Rating: A How-To Guide
How it Works:
Each individual component of the Hagerty Market Rating is comprised of a number of individual measures, with each measure being scored on a scale of 0-100. Each component’s individual measures are combined into a “weighted average” based on how indicative the measure is of market status, which results in the overall score for each component of the Hagerty Market Rating. Like the rating for the individual components, the overall Hagerty Market Rating is a weighted average of the eight components’ individual scores, with those measures that are more correlative of the market’s status treated with more preference in the algorithm.
Therefore, in order to calculate the overall Hagerty Market Rating, each component’s score must be calculated, which in turn requires that each individual measure’s 0-100 score must first be determined. To do this, we calculate each measure’s current performance against its historic performance. Scores for any measures that are based on dollar amounts are calculated using inflation-adjusted values relative to 2014 dollars. The resulting scores are then combined according to their predetermined relative weights for a final number.
For all measures, components, and the overall Hagerty Market Rating, a “bell curve” type distribution is expected, with 0 falling on the far left, 100 falling on the far right, and 50 landing at the curve’s peak. Because of this, the rating is more fluid in 40-60 range, and much more difficult to move at the rating’s extremes.
Components and Individual Measures:
The Hagerty Market Rating features eight components that reflect different aspects of the market:
Component (ordered by weight)
HPG—Editorialized Values
Since Hagerty Price Guide (HPG) publishes new prices every three months, calculations are based on a book-to-book comparison. Also, since HPG increases coverage on an ongoing basis, growth is only determined by comparing vehicles that exist in both the current and previous books. When reporting the Hagerty Market Rating during a timeframe where the new HPG data isn’t available, the value is projected based on past performance.
- HPG—Average Value: calculated by current value. Overall current average condition #3 price for all published vehicles.
- HPG—Median Value: calculated by current value. Overall current median condition #3 price for all published vehicles.
Auction Activity
Auction activity represents a small percentage of annual sales, but is more transparent than any other market channel. Because of this high degree of transparency, Auction Activity closely monitored:
- Auction—Overall Count of Cars Sold: moving 12-month average
- Auction—Median Price of Cars Sold: moving 12-month window
Expert Sentiment
To account for market factors that cannot be quantified through transactional data, a subjective opinion of the market is provided by a carefully curated list of experts. This panel is comprised of subject matter experts from all categories of collectible vehicles.
- Expert Opinion—Market Survey: an averaged score from the results of a poll of experts on 1-100 level of confidence in the market
Hagerty Price Guide: Indices
Hagerty’s Collector Car Indices were the first stock market-style indices designed to report on movement of the classic car market, and the Hagerty Market Rating accounts for performance among two particular indices. Since Hagerty Price Guide (HPG) publishes new prices every three months, calculations are based on a year-to-year comparison. When reporting a Hagerty Market Rating during a timeframe where new HPG data are not available, the value is projected based on past performance.
- Indices—Hagerty Hundred ™: current values as set by average condition #2 value for 100 most popular Year/Make/Models insured by Hagerty that are published in Hagerty Price Guide
- Indices—Hagerty Blue Chip: current values as set by average condition #2 value for the 25 component cars of Hagerty’s Blue Chip Index (most collectible production cars of the post-war era)
Private Sales Activity
Hagerty solicits sale data from its clients, which serves as an indication of activity in the private market. Hagerty’s private transaction database is the largest of its kind in the collector car world.
- Private Sales—Average Sales Price: moving 12-month average price of cars sold through private hands
- Private Sales—% of Cars Selling Above Insured Values: moving 12-month average percentage of cars selling for more than for what they were insured
Insured Values: Broad Market
Cars valued $20,000 – $200,000
Insured values in and of themselves do not provide valuable insight about market values due to a variety of factors, but comparing changes in insured values over time as well as the ratio of clients increasing versus decreasing their insured values (and by how much) is a useful indicator of market performance. Insured values most closely align to the FSBO market. This component is a reflection of mainstream market activity and is weighted accordingly. When considering insured values, Hagerty separates collections with many cars (High End activity) from market activity among owners who own one or two cars (Broad Market) to more accurately isolate performance in the market’s mainstream.
- Broad Market—Ratio of Value Increases to Decreases: moving 12-month average of the ratio of the number of cars that increased their insured value to the number that decreased their insured value
Insured Values: High End
Cars valued above $200,000
The size of the collector car market can dually be defined by the aggregate value and the aggregate number of cars; dividing the insured values segment into high-end collections and broad-market levels allows us to minimize the disproportionate sway high-value cars might exert on these numbers.
- High End—Ratio of Value Increases to Decreases: moving 12-month average of the ratio of the number of cars that increased their insured value to the number that decreased their insured value
Correlated Instruments
While no reliable and direct causation tying the performance of one economic instrument to the performance of classic cars has been established, broader economic factors are certainly correlated to some sectors of the collector car market. Values in the Correlated Instruments component are taken at the first of the month every month, and actual growth is determined month over month. Due to a loose relationship between these instruments and the collector car market, Correlated Instruments are weighted low.
- Correlated—current value of S&P 500
- Correlated—current median US home price index value as reported by Federal Housing Finance Agency.
- Correlated—current spot price of Gold per ounce (USD)
- Correlated—current value of Retail Sales less Food Services Sales (USD)