Hagerty Hundred: How your cars help explain the market
The Hagerty Hundred—a value index of, you guessed it, 100 of the most popular collector cars, is a key set of data that helps us understand the heat of the market. Since we’re often asked how we arrive at our valuation and market strength conclusions, we figured breaking down the rationale for the Hagerty Hundred and how it came to be would shed some light on our processes.
When it comes to making sense of the collector market, it’s not just the ultra-rare Ferraris crossing the auction block that set the tone. Those prancing horses make for nice cover shots, but it takes a lot more than a handful of singular big sales to understand trends. Recognizing that, in 2008 Hagerty created a series of stock-market-style indexes that track segments within the overall market, and together paint a broad picture of the collector car space as a whole.
These Collector Car Indexes run the gamut from muscle cars, to the aforementioned Ferraris, to affordable classics. Each index is made by taking the average value of 10 to 25 component cars from the Hagerty Valuation Tool, which is updated quarterly. Since the component cars never change after the index is created, these indexes can be used to give a historical perspective on that group of vehicles.
In 2015, Hagerty decided to create an index that accommodated a broader swath of the market to further inform the Hagerty Market Rating calculation. This would take a bit of balancing, though: if the list was too large, it wouldn’t differ from the average private sales price data that we already collected. If too few component cars were used, this new index could be over-influenced by a few hot cars. We determined that the 100 then-most popular cars in the market—the cars you are most likely to see at any event or auction, met our objectives. And, since Hagerty is the world’s largest classic car insurer, we had this data readily available.
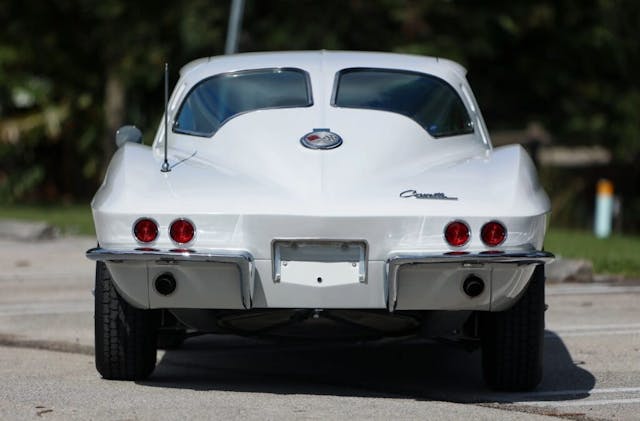
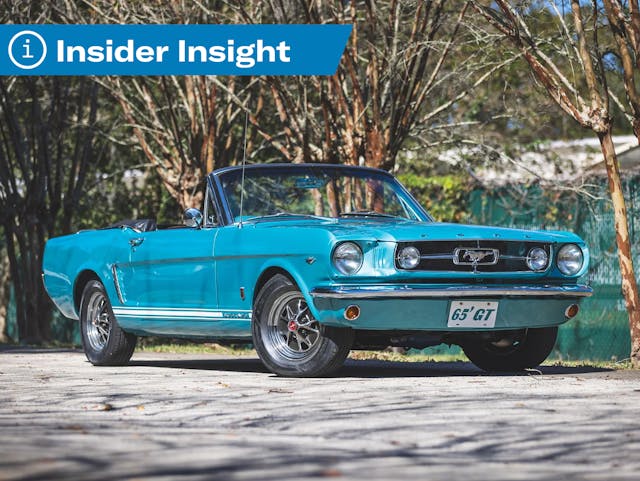
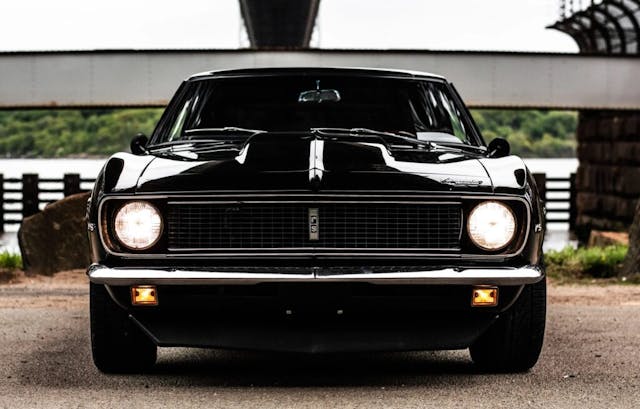
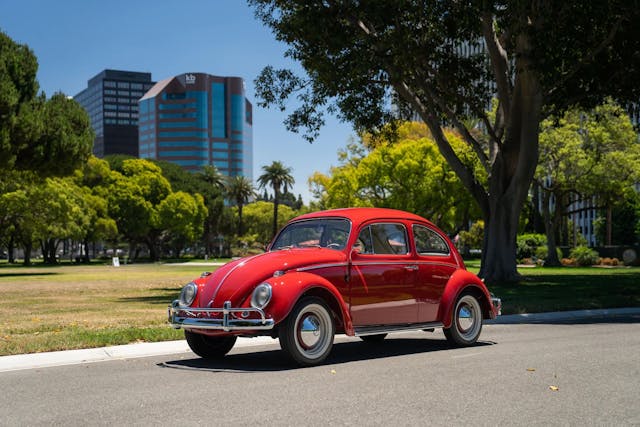
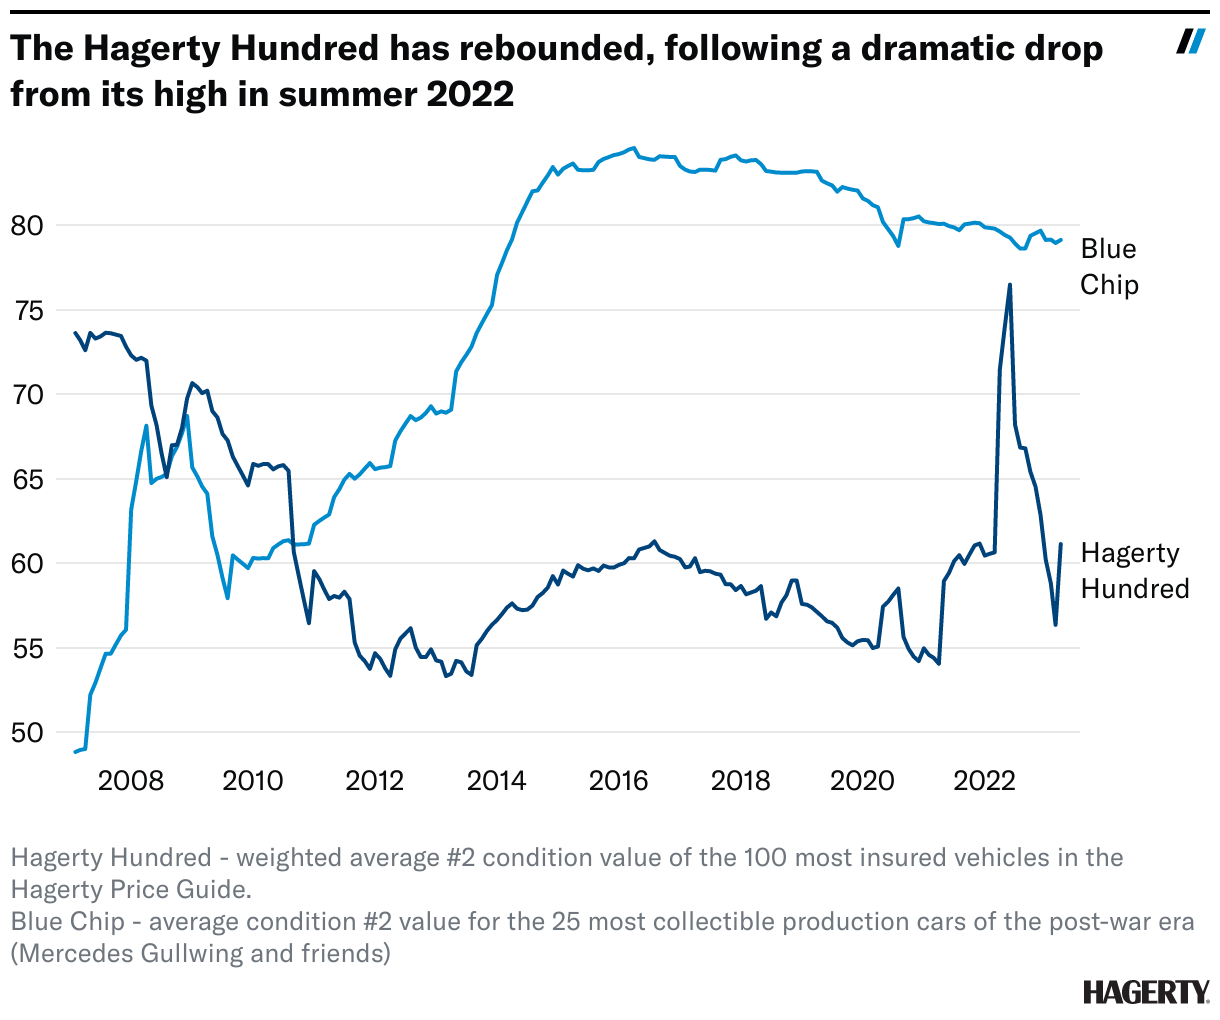
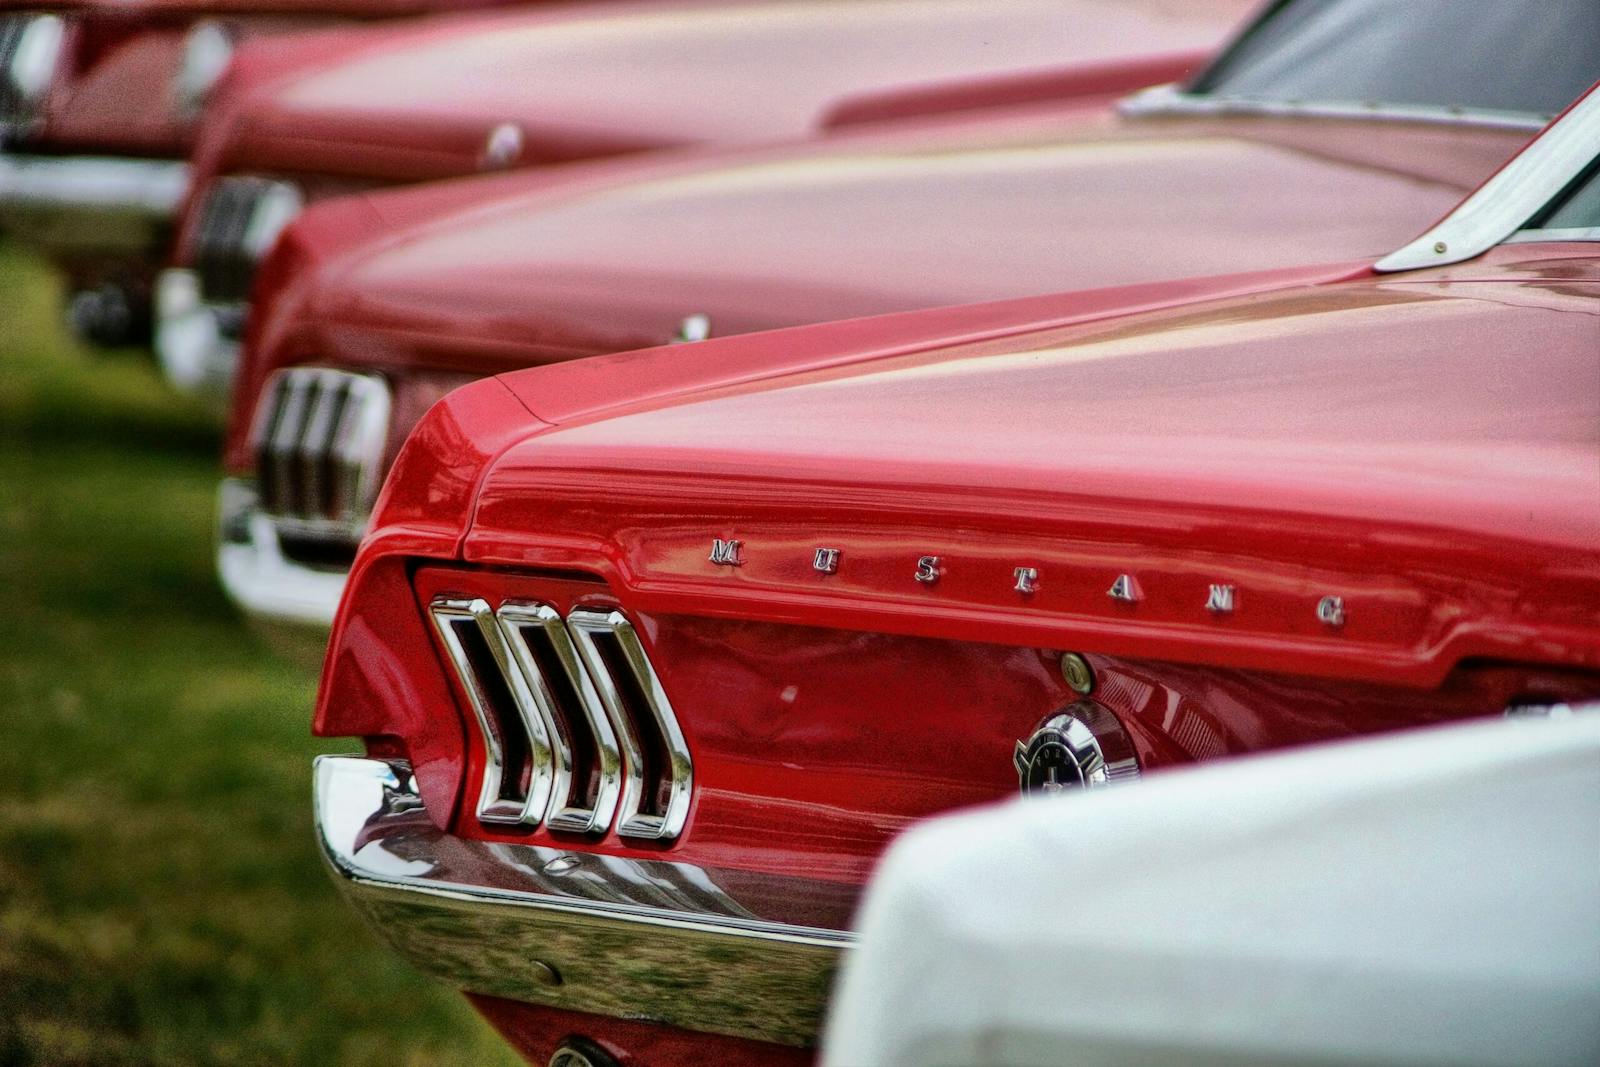
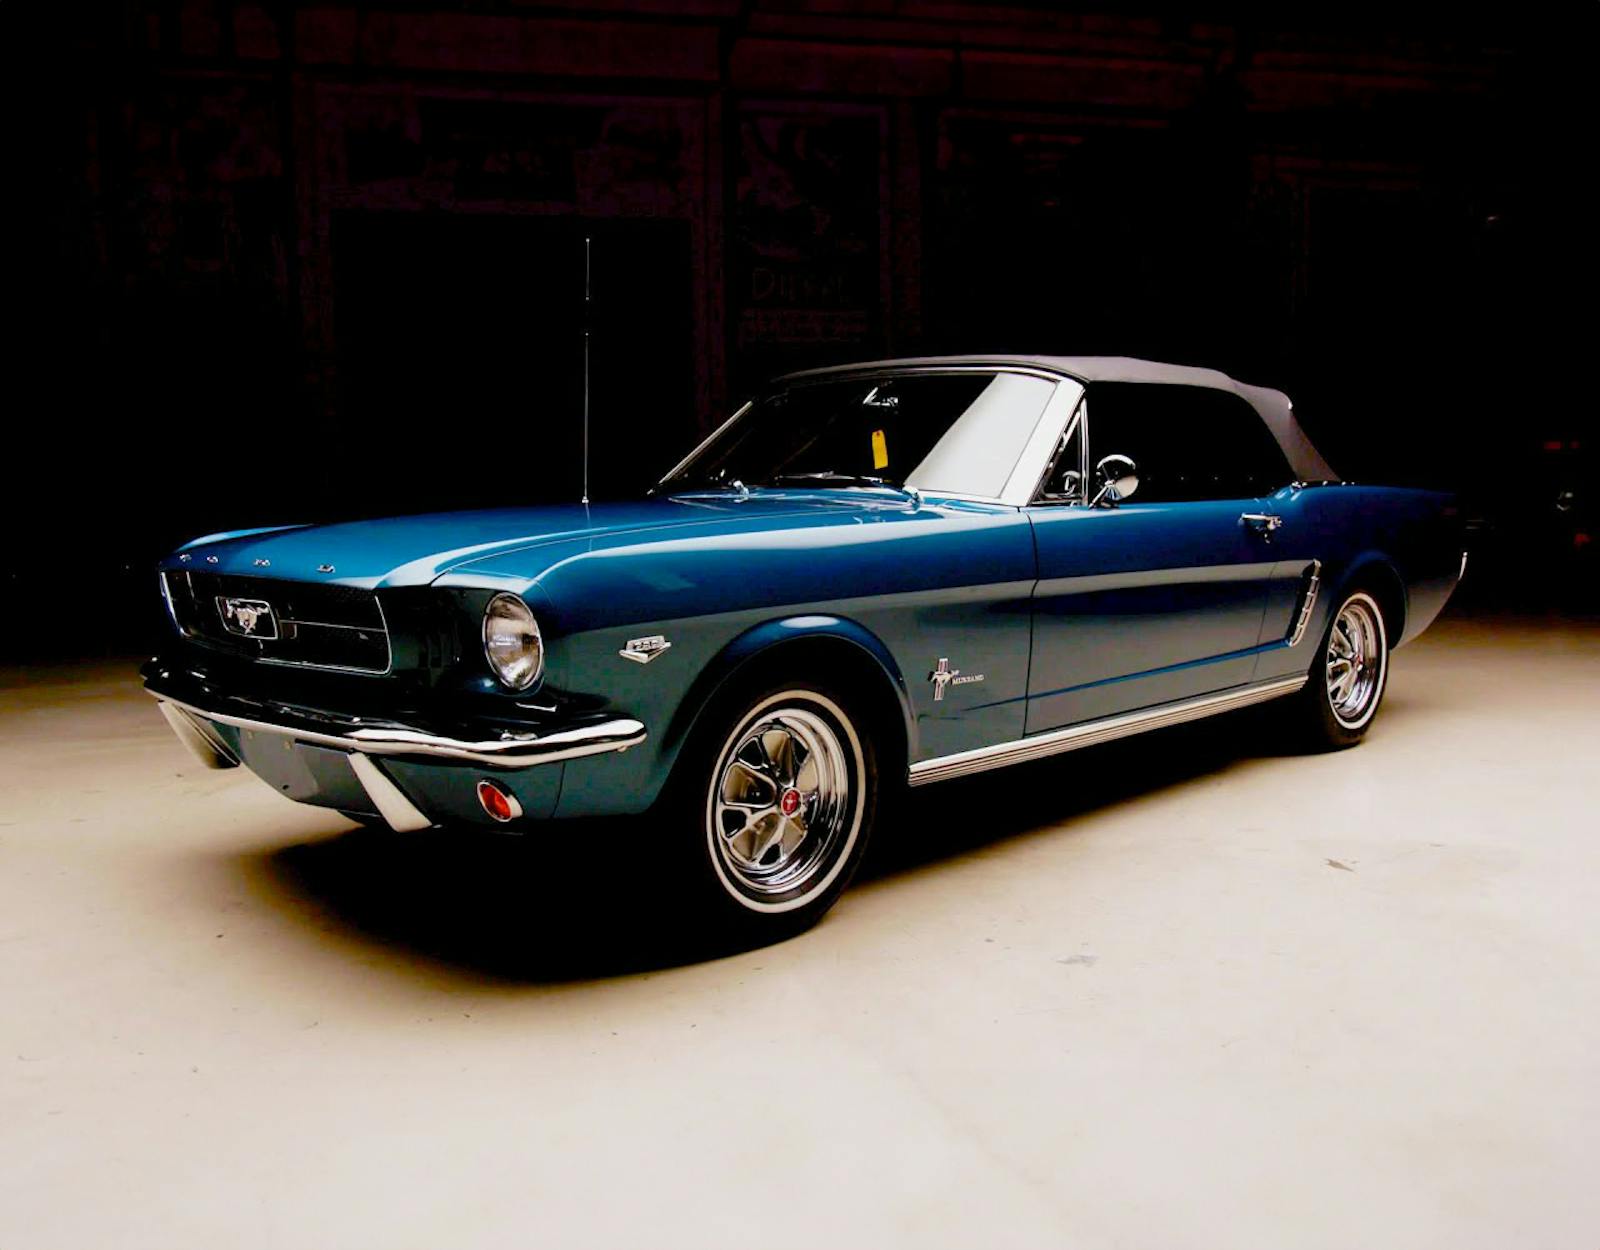
The Hagerty Hundred is a weighted average of the #2-condition value of the 100 most-insured vehicles (the full list is available here) in the Hagerty Price Guide. As you would expect, the Hagerty Hundred leans heavily toward mid-century American performance cars. Various year and engine combinations of the Chevrolet Corvette influence 28 percent of the Hagerty Hundred. Mustangs follow at 21 percent, and Camaros fall in at 11 percent. The only non-American cars on the list are the 1974 Triumph TR6 and four years of the Volkswagen Beetle, which provide only 0.4 percent and 1.5 percent of influence on the Hagerty Hundred, respectively.
Remember, those 100 component cars in the Hagerty Hundred and their corresponding weights were set in stone in 2015 when the index was created in order to provide continuity. Obviously, the 100 most insured vehicles will change over time as trends and demographics change. Despite the evolution that’s occurred since then, the Hagerty Hundred still represents a very large segment of the market.
How has this index helped us? looking at its historical values, it’s clear that the Hagerty Hundred on its own provides a pretty accurate representation of what has happened to the classic car market in recent years.
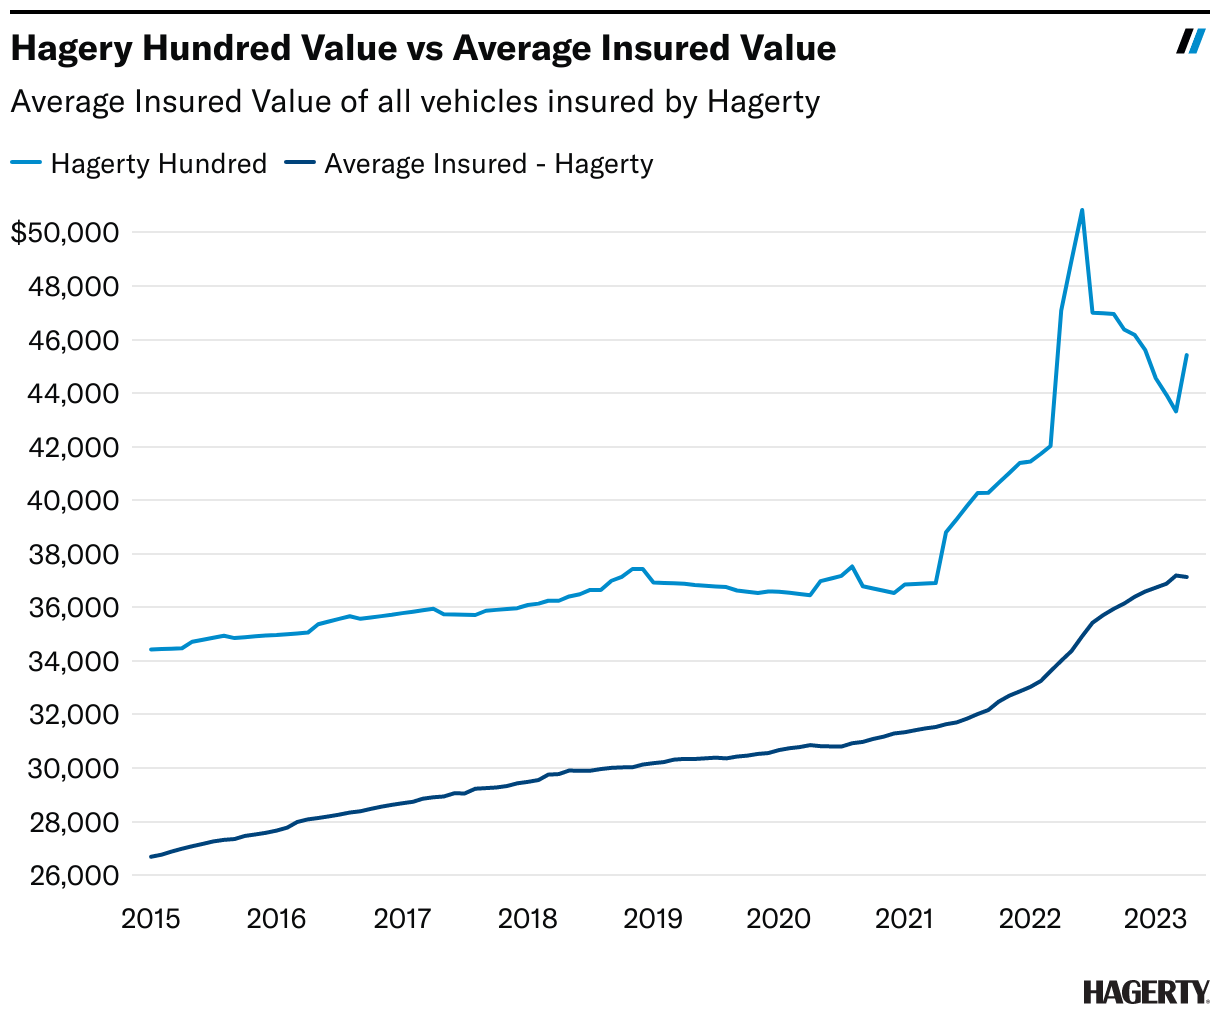
Notably, the pandemic price boom (and minor bust) is very obvious when looking at the value of the Hagerty Hundred. In the years leading up to 2020, the Hagerty Hundred showed steady, predictable growth, following a pace set by the growth across the entire market. Then in 2021, the Hagerty Hundred increased 38 percent in just over a year, mirroring the frenzied bidding we saw at auctions during the pandemic. After the market cooled late last year, the Hagerty Hundred dropped 15 percent and settled at a new, more elevated normal. If you looked solely at the Average Insured Value during this time, it would only show a strong increase in values, leaving out half the story.
This boom and bust cycle was not seen in all of Hagerty’s indexes. The other index used as a component metric in the Hagerty Market Rating is the Blue Chip Index (think Ferrari 250 and its peers). Compared to its loftier brother, the Hagerty Hundred is much more volatile. While cars in the Blue Chip Index held their value after intense growth over a decade ago, the Hagerty Hundred has fluctuated with the broader market. Taken on its own or in context with other segments and economic inputs, the Hagerty Hundred has proven itself a very valuable index.
***
Check out the Hagerty Media homepage so you don’t miss a single story, or better yet, bookmark it. To get our best stories delivered right to your inbox, subscribe to our newsletters.
Via Hagerty Insider
Thanks for re-writing the formerly incomprehensible article on this subject
In the day when one could purchase an intact $35.00 auto, possibly running are long gone. However, there are always jewels hidden somewhere. Finding an obscure make is part of the fun and thank goodness for their loyal followers. The clubs are the heart of the different/obscure marquees, the people who enjoy their chosen brands are what keep these vehicles in the spotlight. Learning about the vehicles, their hiccups, success, and issues that led to their historic rise and falls are very interesting. Long live those vehicles.
So basically the insured value average has gone up is the summary.